Essay
Use the graph below to fill in the table. 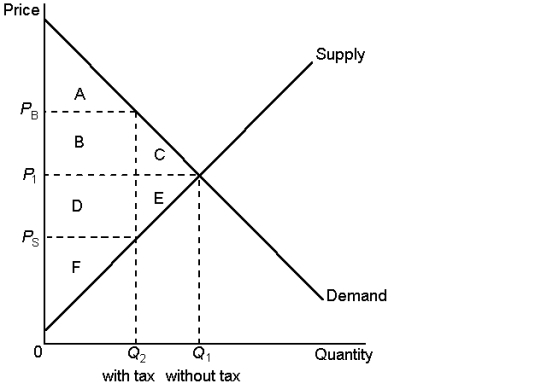
Correct Answer:

Verified
\(\begin{array}{|l|c|c|l|}
\hline & \tex...View Answer
Unlock this answer now
Get Access to more Verified Answers free of charge
Correct Answer:
Verified
\(\begin{array}{|l|c|c|l|}
\hline & \tex...
\hline & \tex...
View Answer
Unlock this answer now
Get Access to more Verified Answers free of charge
Related Questions
Q124: A tax on land:<br>A)would result in a
Q125: Suppose supply is perfectly inelastic, while demand
Q126: The 'underground' economy includes:<br>A)the mining industry<br>B)the illegal
Q127: The Laffer curve indicates that income tax
Q128: The more inelastic the supply and demand
Q130: When a tax on a good is
Q131: When a tax is levied on a
Q132: Graph 8-3 <img src="https://d2lvgg3v3hfg70.cloudfront.net/TB8859/.jpg" alt="Graph 8-3
Q133: A tax levied on the supplier of
Q134: Graph 8-2 <img src="https://d2lvgg3v3hfg70.cloudfront.net/TB8859/.jpg" alt="Graph 8-2