Related Questions
Q16: The lower class limit represents the smallest
Q36: A Pareto chart does not have which
Q37: A Pareto chart is useful for showing
Q38: For the table below, calculate the percent
Q40: An automobile dealer wants to construct a
Q42: Construct a pie graph using the
Q43: Given the following two sets of
Q44: The _ is obtained by first adding
Q45: A _ would most appropriately represent the
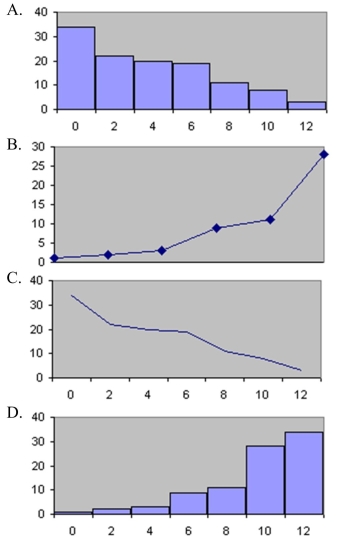
Q46: Which of the following is a histogram?