Multiple Choice
For the table below, calculate the percent of students that fell within the B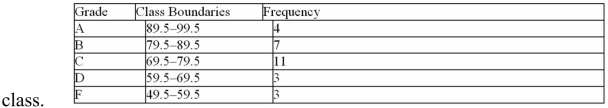
A) 14%
B) 25%
C) 11%
D) 39%
Correct Answer:

Verified
Correct Answer:
Verified
Related Questions
Q16: The lower class limit represents the smallest
Q33: The graphs that have their distributions as
Q34: Which of the following could be an
Q35: A time series graph is useful for
Q36: A Pareto chart does not have which
Q37: A Pareto chart is useful for showing
Q40: An automobile dealer wants to construct a
Q41: Which of the following is a Pareto
Q42: Construct a pie graph using the
Q43: Given the following two sets of