Essay
The stem plot below displays the weights (in ounces)of a random sample of tomatoes grown on a local farm 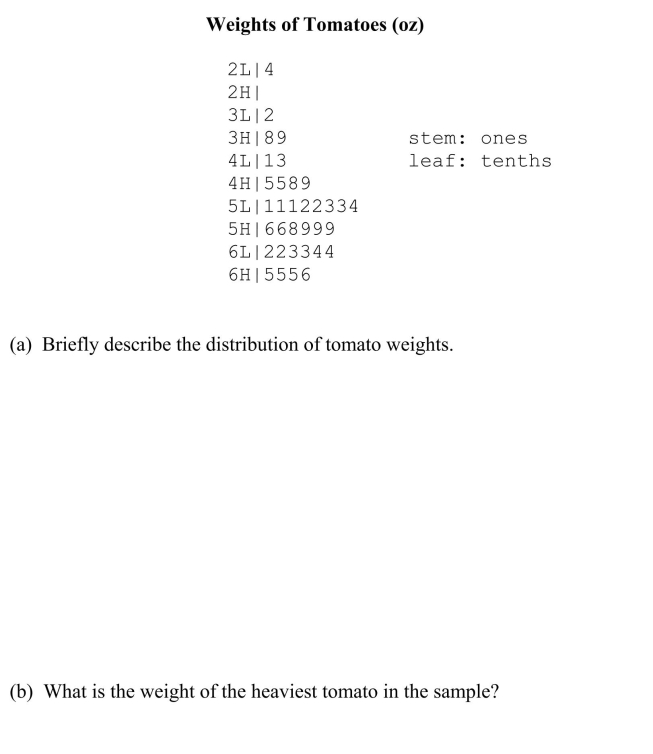
Correct Answer:

Verified
Correct Answer:
Verified
Related Questions
Q1: In the article, "Scaling of Mammalian Long
Q2: An outlier is an unusually small or
Q3: The pie chart below summarizes the results
Q4: Investigators studying the relation between gender and
Q5: An experiment was performed to determine which
Q6: One of the "media messages" sent by
Q8: As part of the United States Census,
Q8: One advantage of histograms is that they
Q20: A curve with tails that decline more
Q24: In a scatter plot, both the horizontal