Essay
Investigators studying the relation between gender and the interests of early adolescents asked boys and girls in grades 5-9 to indicate on a 7-point scale their degree of interest in topics such as Life, Sports, and Cars. The data in the scatter plot represent average levels of interest for boys and girls in grades 5 - 9.Each point represents one topic listed by the investigators.For example, boys average rating for "Opposite sex" as a 6.2, while girls on average rated their interest in this topic as 6.0 on the 7 point interest scale.This is recorded as the point (6.2, 6.0). 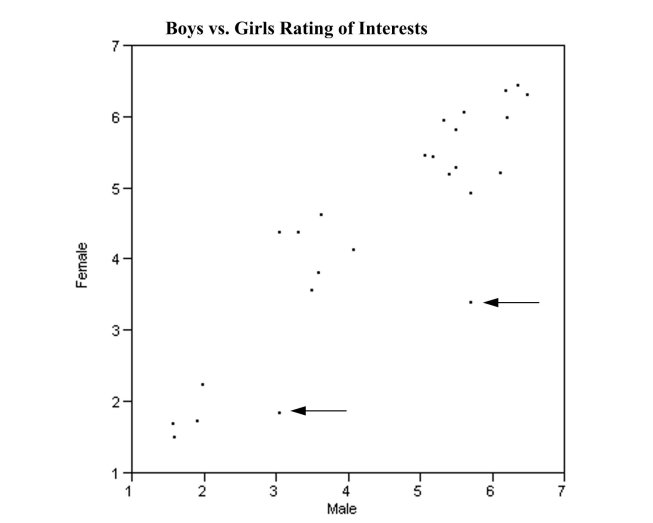 There are three interesting features of this scatter plot that you are to interpret below. What can you infer from each of these features of the scatterplot?
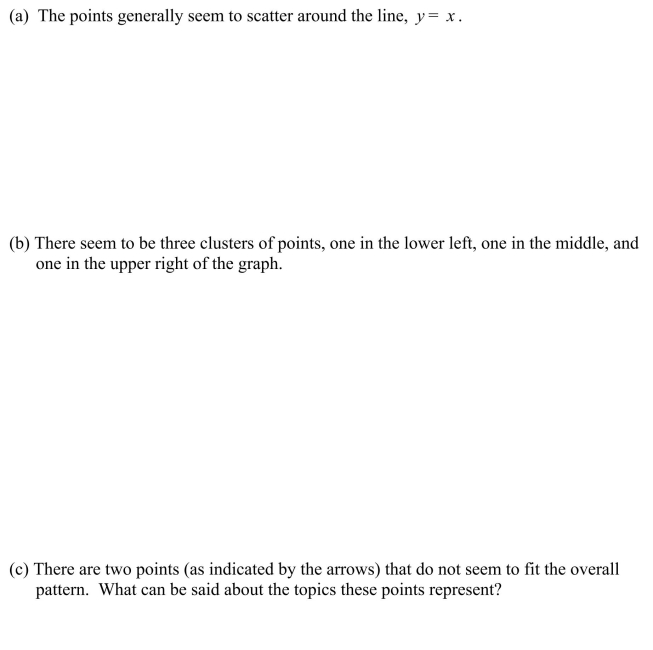
Correct Answer:

Verified
Correct Answer:
Verified
Q1: In the article, "Scaling of Mammalian Long
Q2: The stem plot below displays the weights
Q2: An outlier is an unusually small or
Q3: The pie chart below summarizes the results
Q5: An experiment was performed to determine which
Q6: One of the "media messages" sent by
Q8: As part of the United States Census,
Q8: One advantage of histograms is that they
Q20: A curve with tails that decline more
Q24: In a scatter plot, both the horizontal