Essay
The density curve for a continuous random variable is shown below. Use this curve
to find the following probabilities: 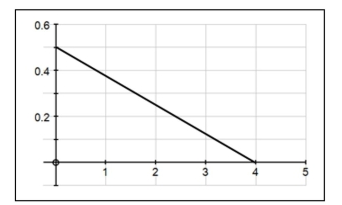
a)
b) is at least
You may need to use the following area formulas in your calculations:
Area of a rectangle:
Area of a trapezoid:
Area of a right triangle:
Correct Answer:

Verified
Correct Answer:
Verified
Q15: In a study performed by the statistics
Q17: Fifty-five percent of the lunches at a
Q18: For every random variable, both discrete
Q19: The number of copies sold of
Q21: <span class="ql-formula" data-value="\text { If random variables
Q22: The density curve for a continuous
Q23: <span class="ql-formula" data-value="\text { For random variables
Q24: Each course at a large university
Q25: Let z denote a random variable
Q31: A normal probability plot suggests that a