Essay
The use of small aircraft with human observers is common in wildlife studies where
the goal is to estimate the abundance of different species. A more economical
strategy might be to use drones. The idea is that a drone would fly over the area of
interest and take photographs for computer analysis. The plot below is from a test run
of drones over 10 areas in South Central Florida. Bird decoys were used to test the
accuracy of the analysis of the photographs. A scatterplot of the actual number of
decoys and the number acquired from applying photographic analysis is shown
below. 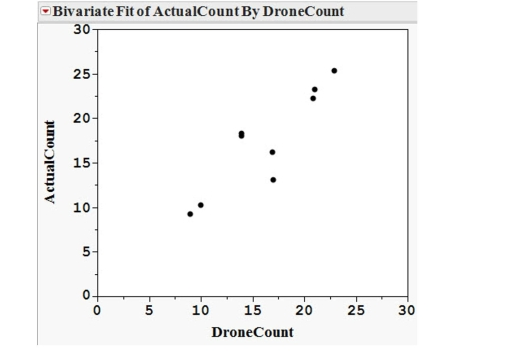
(a) The least squares line is (Drone). Graph this line on the scatterplot above.
(b) The least squares line is the line that minimizes the sum of the squared residuals. Using your line in part (a), graphically represent the residual associated with the drone count of 15 on the scatterplot.
Correct Answer:

Verified
(a)
 b) Sketch should show tw...
View Answer
Unlock this answer now
Get Access to more Verified Answers free of charge
Correct Answer:
Verified
View Answer
Unlock this answer now
Get Access to more Verified Answers free of charge
Q9: The correlation coefficient, r, does not depend
Q10: The value of the correlation coefficient, r,
Q12: Does the transformed model appear to be
Q14: The slope of the least squares line
Q18: If on average y increases as x
Q19: life without their physical capture and
Q20: As early as 3 years of
Q20: The study of prehistoric birds depends on
Q21: The study of prehistoric birds depends
Q27: life without their physical capture and