Essay
As early as 3 years of age, children begin to show preferences for playing with
members of their own sex, and report having more same-sex than opposite-sex
friends. Researchers believe that this may be the result of perceived differences in personality. In a study of 3rd and 4th graders' views on a number personality traits,
children were asked to rate on a "5-point" scale: "someone possessing that trait is probably a boy"
"someone possessing that trait might be a boy"
"can't tell"
"someone possessing that trait might be a girl"
"someone possessing that trait is probably a girl" A scatterplot of the data is presented below. A single point represents the (average
girls' rating, average boys' rating) for a given trait. 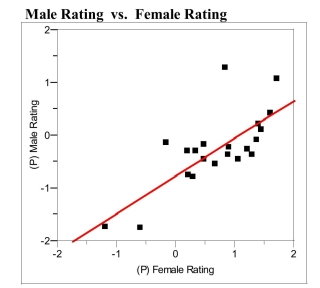
a) Circle the single point that represents the most influential observation. What
aspect of this point makes it the most influential?
b) Suppose a personality trait similar to those used in the survey was given an
average of 0.0 ("can't tell") by the girls. The predicted boys' average rating
would be closest to which of the 5 categories described above?
c) The traits plotted above are those the researchers believe are "positive" traits, such
as "mature," "honest," and "polite." The researchers thought that on average girls
would rate these positive traits as characteristic of girls to a greater extent than
boys would. What aspects of the plot and/or regression analysis presented above
are consistent with this thinking?
Correct Answer:

Verified
a) The point at about  has a small -valu...
View Answer
Unlock this answer now
Get Access to more Verified Answers free of charge
Correct Answer:
Verified
View Answer
Unlock this answer now
Get Access to more Verified Answers free of charge
Q9: The correlation coefficient, r, does not depend
Q10: The value of the correlation coefficient, r,
Q12: Does the transformed model appear to be
Q15: The data below were gathered on
Q16: a) What is the equation of
Q18: If on average y increases as x
Q19: life without their physical capture and
Q20: The study of prehistoric birds depends on
Q21: The study of prehistoric birds depends
Q22: The use of small aircraft with