Essay
As early as 3 years of age, children begin to show preferences for playing with
members of their own sex, and report having more same-sex than opposite-sex
friends. Researchers believe that this may be the result of perceived differences in personality. In a study of 3rd and 4th graders' views on a number personality traits,
children were asked to rate on a "5-point" scale: "someone possessing that trait is probably a boy"
"someone possessing that trait might be a boy"
"can't tell"
"someone possessing that trait might be a girl"
2 = "someone possessing that trait is probably a girl" A scatterplot of the data is presented below. A single point represents the (average
girls' rating, average boys' rating) for a given trait. 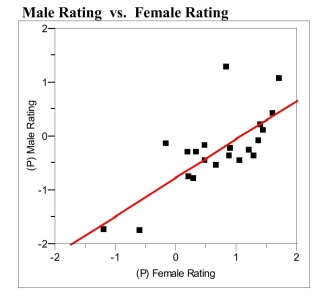
Linear Fit
MRating FRating
Summary of Fit
a) Circle the single point which represents the most influential observation. What
aspect of this point makes it the most influential?
b) Suppose a personality trait similar to those used in the survey was given an
average of 0.0 ("can't tell") by the girls. The predicted boys' average rating would
be closest to which of the 5 categories described above?
c) The traits plotted above are those the researchers believe are "positive" traits, such
as "mature," "honest," and "polite." The researchers thought that on average girls
would rate these positive traits as characteristic of girls to a greater extent than
boys would. What aspects of the plot and/or regression analysis presented above
are consistent with this thinking?
Correct Answer:

Verified
Correct Answer:
Verified
Q2: Assessing the "goodness" of a regression line
Q4: Generally, a relatively small value of
Q5: A large value of <span
Q5: One of the properties of Pearson's r
Q6: The Des Moines Register reported the
Q7: The breeding success of ground-nesting birds
Q9: Early humans were similar in shape
Q11: life without their physical capture and
Q19: The theory of fiber strength suggests that
Q24: The coefficient of determination is equal to