Multiple Choice
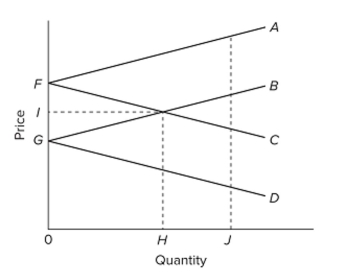 Refer to the diagram, which pertains to two nations and a specific product. Lines FC and GD are
A) domestic supply curves for two countries.
B) domestic demand curves for two countries.
C) import demand curves for two countries.
D) export supply curves for two countries.
Correct Answer:

Verified
Correct Answer:
Verified
Q242: Tariffs and import quotas meant to increase
Q243: The tables give production possibilities data
Q244: The increased-domestic-employment argument for tariff protection holds
Q245: <span class="ql-formula" data-value="\begin{array}{l}\text { Domestic Market For
Q246: A natural-resource abundant nation would be expected
Q248: <img src="https://d2lvgg3v3hfg70.cloudfront.net/TB8601/.jpg" alt=" A) $400, the
Q249: What is the Trade Adjustment Assistance Act?
Q250: Tariffs create larger gains to domestic producers
Q251: Which of the following best describes economists'
Q252: NAFTA established a free-trade area and eliminated