Multiple Choice
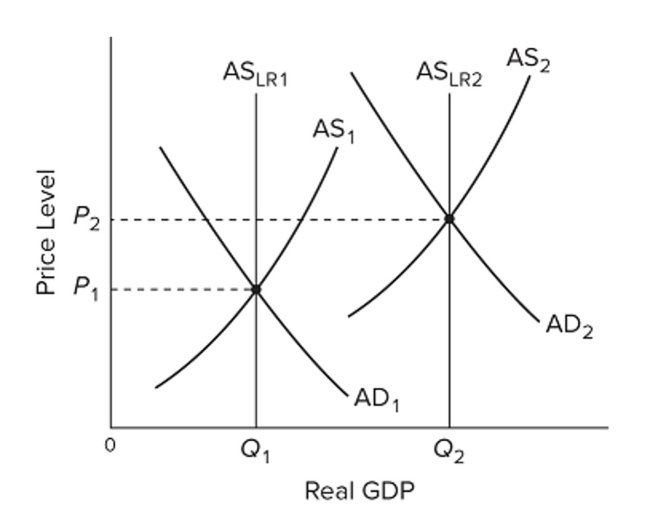 Refer to the graphs, where the subscripts on the labels denote years 1 and 2. From the graphs we can clearly conclude that the economy
A) is not at full employment in either year.
B) is at full employment in year 1 but not in year 2.
C) is at full employment in year 2 but not in year 1.
D) is at full employment in both years.
Correct Answer:

Verified
Correct Answer:
Verified
Q44: <img src="https://d2lvgg3v3hfg70.cloudfront.net/TB8601/.jpg" alt=" Refer
Q45: If government uses fiscal policy to restrain
Q46: <img src="https://d2lvgg3v3hfg70.cloudfront.net/TB8601/.jpg" alt=" Refer to the
Q47: The traditional Phillips Curve suggests a trade-off
Q48: <img src="https://d2lvgg3v3hfg70.cloudfront.net/TB8601/.jpg" alt=" Refer
Q50: What is supply-side economics?
Q51: <img src="https://d2lvgg3v3hfg70.cloudfront.net/TB8601/.jpg" alt=" A) v. B)
Q52: Inflation in the U.S. economy tends to
Q53: <img src="https://d2lvgg3v3hfg70.cloudfront.net/TB8601/.jpg" alt=" A)
Q54: In an aggregate demand-aggregate supply framework, fiscal