Multiple Choice
 Refer to the diagram for a specific economy. Which of the following best describes the relationship shown by this curve?
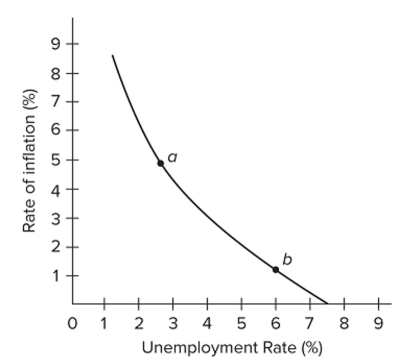
A) The demand for labor is large when the rate of inflation is low.
B) When the rate of unemployment is high, the rate of inflation is high.
C) The rate of inflation and the rate of unemployment are inversely related.
D) The rate of inflation and the rate of unemployment are directly related.
Correct Answer:

Verified
Correct Answer:
Verified
Q2: The short-run aggregate supply curve shifts to
Q3: The idea that reductions in tax rates
Q4: There is no trade-off between unemployment and
Q5: What will occur in the short run
Q6: Explain the reasoning behind why the long-run
Q7: An adverse aggregate supply shock could result
Q8: <img src="https://d2lvgg3v3hfg70.cloudfront.net/TB8601/.jpg" alt=" A) v. B)
Q9: If government uses its stabilization policies to
Q10: <img src="https://d2lvgg3v3hfg70.cloudfront.net/TB8601/.jpg" alt=" Refer
Q11: <img src="https://d2lvgg3v3hfg70.cloudfront.net/TB8601/.jpg" alt=" A) v. B)