Multiple Choice
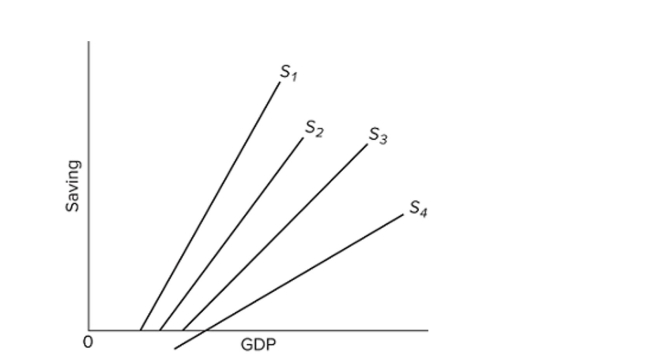 The figure shows the saving schedules for economies 1, 2, 3, and 4. Which economy has the highest marginal propensity to consume?
A) 1
B) 2
C) 3
D) 4
Correct Answer:

Verified
Correct Answer:
Verified
Q131: When the marginal propensity to consume is
Q132: <img src="https://d2lvgg3v3hfg70.cloudfront.net/TB8601/.jpg" alt=" Refer to the
Q133: <img src="https://d2lvgg3v3hfg70.cloudfront.net/TB8601/.jpg" alt=" Refer to the
Q134: An upward shift of the saving schedule
Q135: The APC can be defined as the
Q137: <img src="https://d2lvgg3v3hfg70.cloudfront.net/TB8601/.jpg" alt=" Refer to the
Q138: Assume there are no prospective investment
Q139: Dissaving occurs when<br>A) income is greater than
Q140: If Carol's disposable income increases from $1,200
Q141: If disposable income increases from $912 to