Multiple Choice
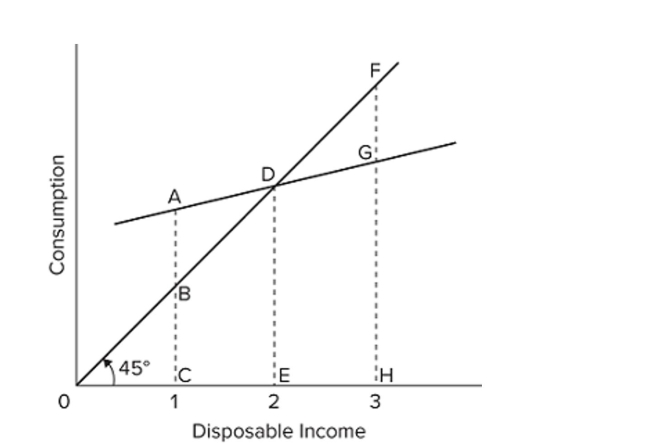 Refer to the consumption schedule shown in the graph. At income level 3, the amount of consumption is represented by the line segment
A) FG.
B) FH.
C) FD.
D) GH.
Correct Answer:

Verified
Correct Answer:
Verified
Q127: The saving schedule is drawn on the
Q128: The real interest rate is<br>A) the percentage
Q129: If a $500 billion increase in investment
Q130: <img src="https://d2lvgg3v3hfg70.cloudfront.net/TB8601/.jpg" alt=" Refer to the
Q131: When the marginal propensity to consume is
Q133: <img src="https://d2lvgg3v3hfg70.cloudfront.net/TB8601/.jpg" alt=" Refer to the
Q134: An upward shift of the saving schedule
Q135: The APC can be defined as the
Q136: <img src="https://d2lvgg3v3hfg70.cloudfront.net/TB8601/.jpg" alt=" The figure shows
Q137: <img src="https://d2lvgg3v3hfg70.cloudfront.net/TB8601/.jpg" alt=" Refer to the