Multiple Choice
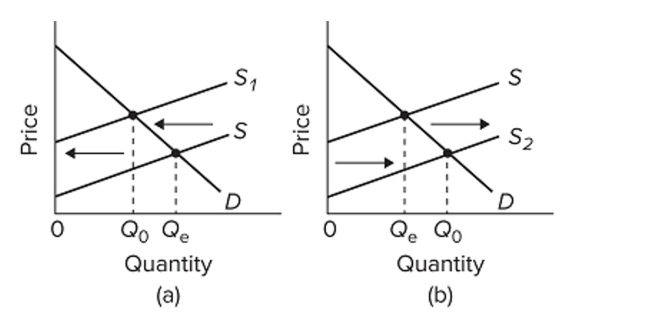 Refer to the diagrams for two separate product markets. Assume that society's optimal level of output in each market is Q0 and that government purposely shifts the market supply curve from S to
S1 in diagram (a) on the left and from S to S2 in diagram (b) on the right. The shift of the supply curve
From S to S1 in diagram (a) might be caused by a per-unit
A) subsidy paid to the producers of this product.
B) tax on the producers of this product.
C) subsidy paid to the buyers of this product.
D) tax on the buyers of this product.
Correct Answer:

Verified
Correct Answer:
Verified
Q202: If the consumer is willing to pay
Q203: Credit bureaus provide credit histories to banks
Q204: Other things equal, a fall in the
Q205: At equilibrium in a market for a
Q206: External benefits in consumption refer to benefits
Q208: <img src="https://d2lvgg3v3hfg70.cloudfront.net/TB8601/.jpg" alt=" Refer to the
Q209: <img src="https://d2lvgg3v3hfg70.cloudfront.net/TB8601/.jpg" alt=" Refer to the
Q210: When there is allocative efficiency in a
Q211: (Consider This) When you enter a congested
Q212: An efficiency loss (or deadweight loss)<br>A) is