Multiple Choice
 Refer to the provided supply and demand graph. S1 and D1 represent the current market supply and demand, respectively. S2 and D2 represent the socially optimal supply and demand. One way that
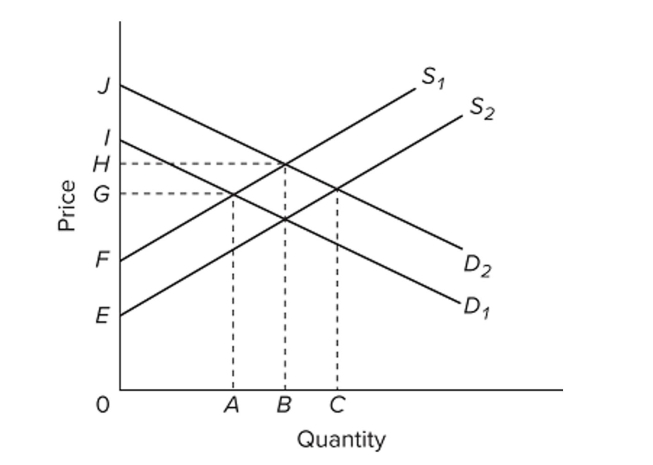
The government could shift demand to its socially optimal level is to
A) tax the sellers.
B) tax the buyers.
C) subsidize the sellers.
D) subsidize the buyers.
Correct Answer:

Verified
Correct Answer:
Verified
Q203: Credit bureaus provide credit histories to banks
Q204: Other things equal, a fall in the
Q205: At equilibrium in a market for a
Q206: External benefits in consumption refer to benefits
Q207: <img src="https://d2lvgg3v3hfg70.cloudfront.net/TB8601/.jpg" alt=" Refer to the
Q209: <img src="https://d2lvgg3v3hfg70.cloudfront.net/TB8601/.jpg" alt=" Refer to the
Q210: When there is allocative efficiency in a
Q211: (Consider This) When you enter a congested
Q212: An efficiency loss (or deadweight loss)<br>A) is
Q213: The socially optimal amount of pollution abatement