Multiple Choice
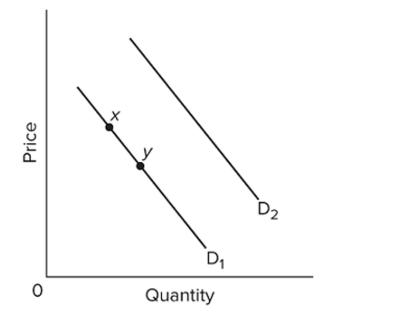 Refer to the diagram. A decrease in quantity demanded is depicted by a
A) move from point x to point y.
B) shift from D1 to D2.
C) shift from D2 to D1.
D) move from point y to point x.
Correct Answer:

Verified
Correct Answer:
Verified
Related Questions
Q80: <img src="https://d2lvgg3v3hfg70.cloudfront.net/TB8601/.jpg" alt=" Refer to the
Q81: <img src="https://d2lvgg3v3hfg70.cloudfront.net/TB8601/.jpg" alt=" Refer to the
Q82: As a result of a fall in
Q83: The figure below shows three demand curves
Q84: The location of the product supply curve
Q86: There is a shortage in a market
Q87: The figure below shows three demand curves
Q88: There will be a surplus of a
Q89: Allocative efficiency involves determining<br>A) which output mix
Q90: Plastics manufacturers can make either toys or