Multiple Choice
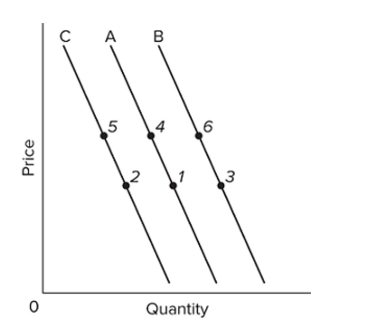 Refer to the above graph with three demand curves. An "increase in quantity demanded" would be illustrated by a change from
A) point 4 to point 6.
B) point 5 to point 1.
C) point 4 to point 1.
D) point 2 to point 5.
Correct Answer:

Verified
Correct Answer:
Verified
Q75: A market<br>A) reflects upsloping demand and downsloping
Q76: Which of the following will cause the
Q77: What is the likely effect on the
Q78: When the price of a product rises,
Q79: <img src="https://d2lvgg3v3hfg70.cloudfront.net/TB8601/.jpg" alt=" Refer to the
Q81: <img src="https://d2lvgg3v3hfg70.cloudfront.net/TB8601/.jpg" alt=" Refer to the
Q82: As a result of a fall in
Q83: The figure below shows three demand curves
Q84: The location of the product supply curve
Q85: <img src="https://d2lvgg3v3hfg70.cloudfront.net/TB8601/.jpg" alt=" Refer to the