Multiple Choice
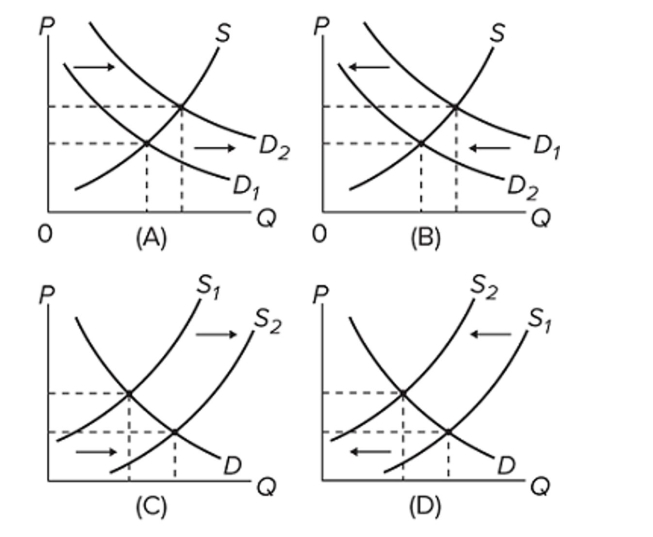 Which of the diagrams illustrate(s) the effect of a decline in the price of personal computers on the market for software?
A) A only
B) A and D
C) B only
D) D only
Correct Answer:

Verified
Correct Answer:
Verified
Related Questions
Q249: Assume that the graphs show a competitive
Q250: When the price of a product falls,
Q251: <img src="https://d2lvgg3v3hfg70.cloudfront.net/TB8601/.jpg" alt=" Which of the
Q252: Which of the following is not a
Q253: If demand increases and supply simultaneously decreases,
Q255: If we say that a price is
Q256: A demand curve<br>A) shows the relationship between
Q257: Which of the following would not shift
Q258: An increase in the price of digital
Q259: What combination of changes would most likely