Multiple Choice
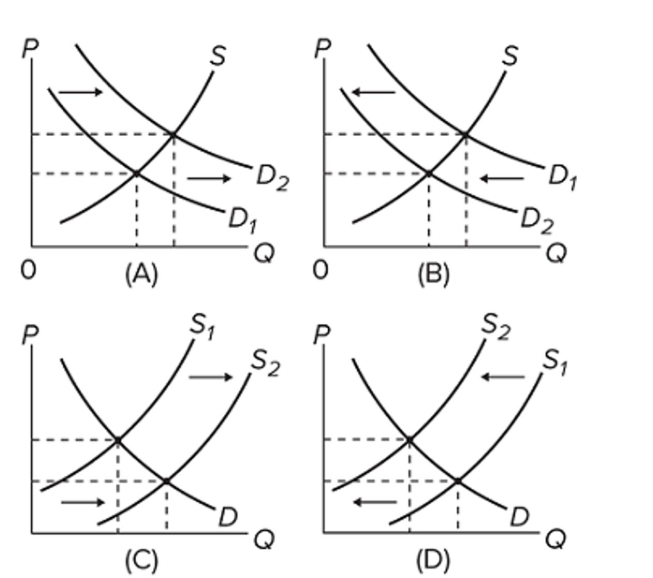 Which of the diagrams illustrate(s) the effect of a decline in the price of irrigation equipment on the market for corn?
A) B only
B) C only
C) B and C
D) D only
Correct Answer:

Verified
Correct Answer:
Verified
Related Questions
Q246: <span class="ql-formula" data-value="\begin{array} { | c |
Q247: Suppose that a more efficient way to
Q248: The law of demand states that, other
Q249: Assume that the graphs show a competitive
Q250: When the price of a product falls,
Q252: Which of the following is not a
Q253: If demand increases and supply simultaneously decreases,
Q254: <img src="https://d2lvgg3v3hfg70.cloudfront.net/TB8601/.jpg" alt=" Which of the
Q255: If we say that a price is
Q256: A demand curve<br>A) shows the relationship between