Multiple Choice
 Refer to the above graph. An increase in price, other factors constant, would cause a change from
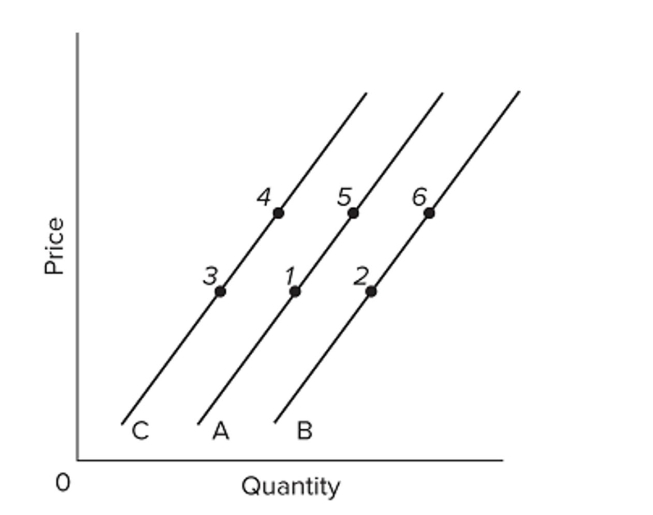
A) point 5 to point 1.
B) point 4 to point 5.
C) point 1 to point 6.
D) point 3 to point 4.
Correct Answer:

Verified
Correct Answer:
Verified
Q87: The figure below shows three demand curves
Q88: There will be a surplus of a
Q89: Allocative efficiency involves determining<br>A) which output mix
Q90: Plastics manufacturers can make either toys or
Q91: (Consider This) Uber's dynamic pricing<br>A) prevents regulated
Q93: Assuming competitive markets with typical supply and
Q94: <img src="https://d2lvgg3v3hfg70.cloudfront.net/TB8601/.jpg" alt=" Refer to the
Q95: <span class="ql-formula" data-value="\begin{array} { | c |
Q96: A and B are substitute goods, but
Q97: <span class="ql-formula" data-value="\begin{array} { | c |