Multiple Choice
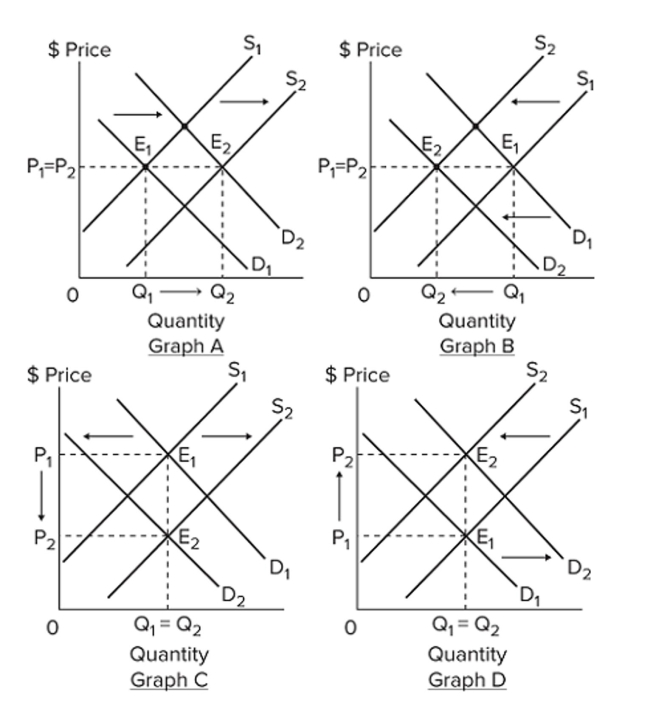 Refer to the four graphs above. Select the graph that best shows the changes in demand and supply in the market specified in the following situation: the market for beef, if a new diet fad
Favoring beef consumption becomes hugely popular, while cattle producers see steeply rising costs
Of cattle feed.
A) Graph A
B) Graph B
C) Graph C
D) Graph D
Correct Answer:

Verified
Correct Answer:
Verified
Q89: Allocative efficiency involves determining<br>A) which output mix
Q90: Plastics manufacturers can make either toys or
Q91: (Consider This) Uber's dynamic pricing<br>A) prevents regulated
Q92: <img src="https://d2lvgg3v3hfg70.cloudfront.net/TB8601/.jpg" alt=" Refer to the
Q93: Assuming competitive markets with typical supply and
Q95: <span class="ql-formula" data-value="\begin{array} { | c |
Q96: A and B are substitute goods, but
Q97: <span class="ql-formula" data-value="\begin{array} { | c |
Q98: Suppose product X is an input in
Q99: Given a downsloping demand curve and an