Multiple Choice
Diagram 1
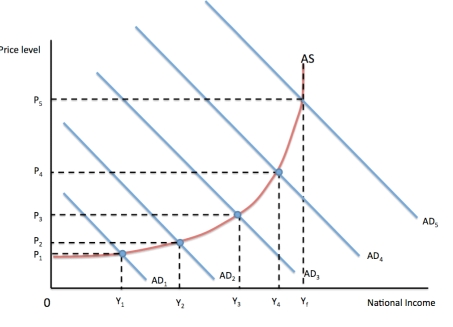
-Refer to Diagram 2 above.Shifting the aggregate supply curve to the right
A) makes no change to the full employment level of output.
B) increases the full employment level of output.
C) decreases the full employment level of output.
D) leads to a change in aggregate demand.
Correct Answer:

Verified
Correct Answer:
Verified
Q5: Which term describes the selling off of
Q15: A cut in higher rate taxes has
Q18: Which of the following reduces labour flexibility?<br>A)
Q20: The actual output gap is difficult to
Q21: Which best describes an example of a
Q24: Deregulation is when<br>A)the government sub-contracts with private
Q25: Bottlenecks will occur when<br>A)the output gap is
Q27: Financial deregulation can lead to<br>A)an explosion of
Q30: Diagram 1<br> <img src="https://d2lvgg3v3hfg70.cloudfront.net/TB8816/.jpg" alt="Diagram 1
Q33: The aggregate supply curve can shift because