Multiple Choice
Diagram 1
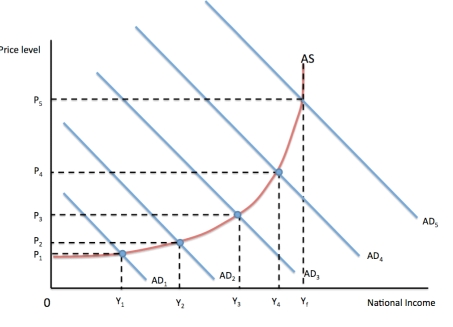
-Refer to Diagram 2 above.The effect of deregulation should result in
A) a shift to the right of the aggregate demand curve.
B) a shift to the left of the aggregate demand curve.
C) a shift to the right of the aggregate supply curve.
D) a shift to the left of the aggregate supply curve.
Correct Answer:

Verified
Correct Answer:
Verified
Q5: Which term describes the selling off of
Q15: A cut in higher rate taxes has
Q18: Which of the following reduces labour flexibility?<br>A)
Q20: The actual output gap is difficult to
Q21: Which best describes an example of a
Q25: Bottlenecks will occur when<br>A)the output gap is
Q27: Financial deregulation can lead to<br>A)an explosion of
Q29: Diagram 1<br> <img src="https://d2lvgg3v3hfg70.cloudfront.net/TB8816/.jpg" alt="Diagram 1
Q33: The aggregate supply curve can shift because
Q35: With deregulated markets the government should<br>A)ensure that