Multiple Choice
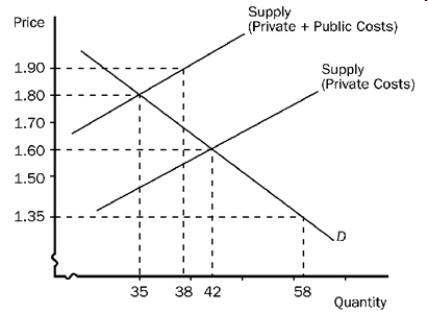
-Refer to the figure above. This diagram represents the tobacco industry. The socially optimal price and quantity exchanged are
A) R19.00 and 38 units.
B) R18.00 and 35 units.
C) R16.00 and 42 units.
D) R13.50 and 58 units.
Correct Answer:

Verified
Correct Answer:
Verified
Q3: To internalise a negative externality, an appropriate
Q4: <img src="https://d2lvgg3v3hfg70.cloudfront.net/TB8829/.jpg" alt=" -Refer to the
Q10: Tax evasion is<br>A) illegal, finding loopholes in
Q11: Tax avoidance is<br>A) illegal, finding loopholes in
Q17: A positive externality is an external benefit
Q38: Market failure in the form of externalities
Q39: To produce honey, beekeepers place hives of
Q40: Why do economists prefer Pigovian taxes over
Q45: When a person drives a car that
Q146: Using a supply and demand diagram, demonstrate