Multiple Choice
The figure given below shows the consumption function of a household.
Figure 9.2
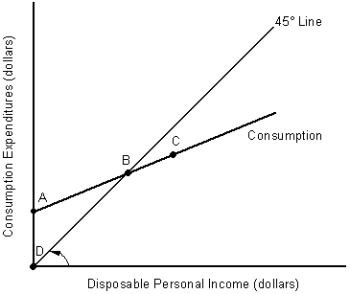
-In Figure 9.2, the line segment AD represents:
A) autonomous consumption.
B) the maximum amount of saving.
C) negative consumption.
D) zero consumption.
E) autonomous income.
Correct Answer:

Verified
Correct Answer:
Verified
Q2: Dissaving occurs when the consumption function lies
Q52: As disposable income increases, consumption spending will
Q65: Which of the following statements is true?<br>A)Real
Q67: In the country of Marzipana, total consumption
Q86: Once macroeconomic equilibrium has been established in
Q96: Other things equal, when Europeans want to
Q109: At the point where consumption equals disposable
Q117: The table given below reports the
Q119: The figure given below represents the consumption
Q120: The figure given below shows the consumption