Multiple Choice
The figure given below represents the consumption function of a country.
Figure 9.3
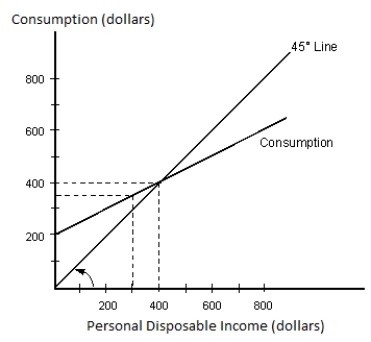
-Refer to Figure 9.3. We can infer that the marginal propensity to save would be _____.
A) 0.7
B) 0.1
C) 0.4
D) 0.25
E) 0.5
Correct Answer:

Verified
Correct Answer:
Verified
Q2: Dissaving occurs when the consumption function lies
Q52: As disposable income increases, consumption spending will
Q65: Which of the following statements is true?<br>A)Real
Q67: In the country of Marzipana, total consumption
Q86: Once macroeconomic equilibrium has been established in
Q96: Other things equal, when Europeans want to
Q109: At the point where consumption equals disposable
Q115: The figure given below shows the consumption
Q117: The table given below reports the
Q120: The figure given below shows the consumption