Multiple Choice
The figure given below shows the consumption function of a household.
Figure 9.2
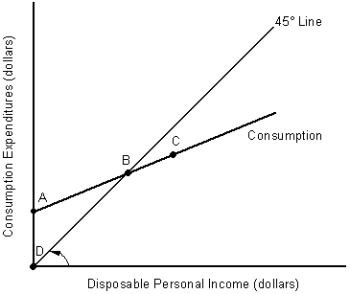
-In Figure 9.2, a decrease in disposable income would be illustrated by:
A) shifting the whole consumption function upward.
B) shifting the whole consumption function downward.
C) moving along the consumption function to the left.
D) moving along the consumption function to the right.
E) moving from point A to point D.
Correct Answer:

Verified
Correct Answer:
Verified
Q7: Suppose that the consumption function crosses the
Q17: Which of the following would cause a
Q20: Changes in autonomous consumption will affect the
Q42: The part of the disposable income that
Q48: Households in America tend to consume more
Q63: The figure given below represents the consumption
Q65: The figure given below shows the aggregate
Q67: Table 9.2<br> <span class="ql-formula" data-value="\begin{array}
Q69: Suppose the Kwik Print Company considers an
Q108: Which of the following factors will not