Multiple Choice
The figure given below represents the consumption function of a country.
Figure 9.3
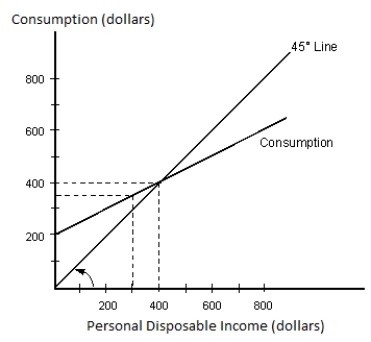
-Refer to Figure 9.3. If the marginal propensity to consume is equal to 0.3, then:
A) autonomous consumption would decrease.
B) the total amount of dissaving would increase.
C) consumption spending would equal disposable income at an income level greater than $400.
D) consumption spending would equal disposable income at an income level less than $400.
E) consumption spending would equal disposable income at the same income level of $400.
Correct Answer:

Verified
Correct Answer:
Verified
Q7: Suppose that the consumption function crosses the
Q20: Changes in autonomous consumption will affect the
Q27: Which of the following is true of
Q42: The part of the disposable income that
Q47: Planned investment is inversely related to the
Q48: Households in America tend to consume more
Q57: Autonomous consumption is defined as:<br>A)the domestic consumption
Q65: The figure given below shows the aggregate
Q66: The figure given below shows the consumption
Q67: Table 9.2<br> <span class="ql-formula" data-value="\begin{array}