Multiple Choice
The figure given below represents the consumption function of a country.
Figure 9.3
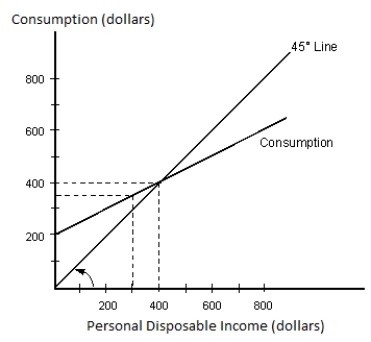
-Refer to Figure 9.3. Calculate the marginal propensity to consume.
A) 0.7
B) 0.1
C) 0.4
D) 0.25
E) 0.5
Correct Answer:

Verified
Correct Answer:
Verified
Related Questions
Q3: The average propensity to save (APS)is the
Q41: The figure given below represents the consumption
Q44: The figure given below shows the consumption
Q49: An increase in the marginal propensity to
Q59: When we assume that investment is autonomous
Q62: Which of the following will cause the
Q71: Investment is considered to be positively correlated
Q75: Identify the correct statement.<br>A)Autonomous consumption equals saving
Q95: Suppose the marginal propensity to import for
Q110: Which of the following is a stock