Multiple Choice
The figure given below shows the consumption functions of an economy.
Figure 9.4
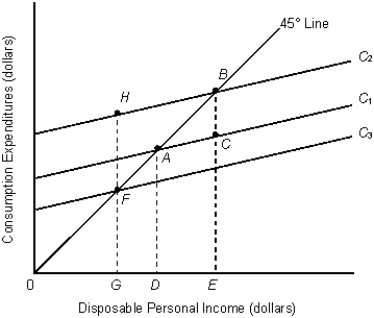
-Refer to Figure 9.4. Which of the following could explain a downward shift of the consumption function from C1 to C3?
A) An increase in household wealth
B) A decrease in the proportion of young people in the population
C) An increase in the size of the population
D) A decrease in consumer confidence
E) An autonomous decrease in saving
Correct Answer:

Verified
Correct Answer:
Verified
Q3: The average propensity to save (APS)is the
Q24: The slope of the aggregate expenditures function
Q41: The figure given below represents the consumption
Q45: The figure given below represents the consumption
Q49: An increase in the marginal propensity to
Q59: When we assume that investment is autonomous
Q62: Which of the following will cause the
Q71: Investment is considered to be positively correlated
Q75: Identify the correct statement.<br>A)Autonomous consumption equals saving
Q95: Suppose the marginal propensity to import for