Multiple Choice
Each of the panels given below represents the short-run equilibrium in the U.S. economy. The Aggregate Demand and Aggregate Supply curves in each panel responds to various economic changes.
Figure 8.1
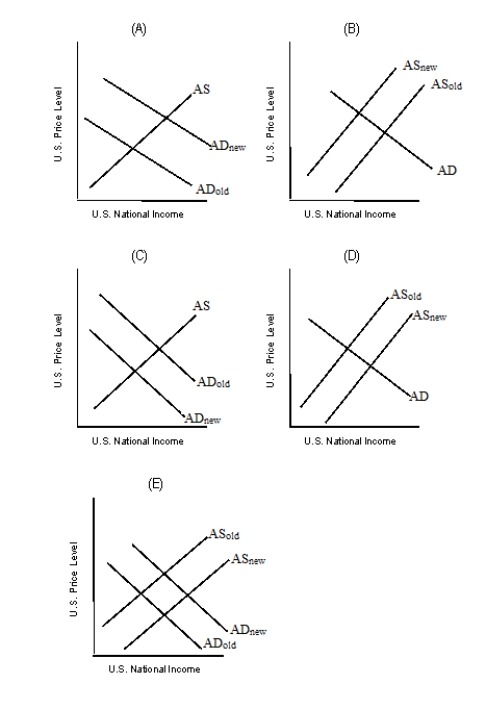
-Refer to Figure 8.1. Which of the graphs in the figure best describes the impact of lower real income in Germany on U.S. equilibrium real GDP and the U.S. equilibrium price level?
A) Panel A
B) Panel B
C) Panel C
D) Panel D
E) Panel E
Correct Answer:

Verified
Correct Answer:
Verified
Q8: The figure given below represents the equilibrium
Q10: The figure given below represents the long-run
Q21: The fact that the aggregate demand curve
Q26: The AD curve will shift to the
Q42: Suppose a representative household holds a bond
Q49: A rightward shift in the aggregate supply
Q67: As the level of real GDP increases,
Q92: Other things equal, a decrease in government
Q101: To determine short-run equilibrium in the economy,
Q118: Other things equal, investment spending will increase