Multiple Choice
The figure given below represents the long-run equilibrium in the aggregate demand and aggregate supply model.
Figure 8.2
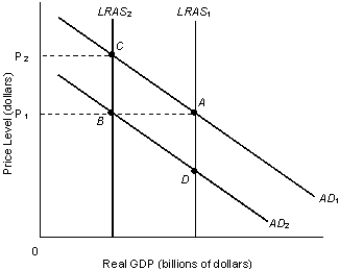
-Refer to Figure 8.2. Suppose major oil-exporting countries restrict oil output, thus increasing the price of oil. This would be represented by:
A) a movement from A to C.
B) a movement from A to B to C.
C) a movement from B to C.
D) a movement from B to A.
E) a movement from C to A.
Correct Answer:

Verified
Correct Answer:
Verified
Q5: Each of the panels given below represents
Q8: The figure given below represents the equilibrium
Q10: If a large number of laborers shift
Q17: The long-run aggregate supply of an economy
Q21: The fact that the aggregate demand curve
Q49: A rightward shift in the aggregate supply
Q51: A simultaneous increase in inflation and decrease
Q67: As the level of real GDP increases,
Q92: Other things equal, a decrease in government
Q116: Identify the correct statement.<br>A)Investment is positively related