Multiple Choice
The figure given below represents the long-run equilibrium in the aggregate demand and aggregate supply model.
Figure 8.2
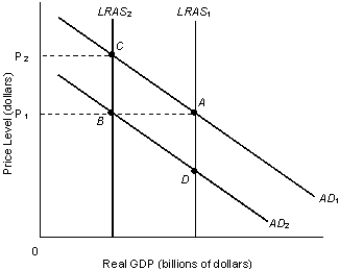
-Refer to Figure 8.2. The combination of rising prices and falling output is known as stagflation. This phenomenon is represented by which of the following shifts?
A)
B)
C)
D)
E) The combination oftoand to
Correct Answer:

Verified
Correct Answer:
Verified
Q15: What happens to aggregate supply when production
Q18: Lower interest rates on business loans usually
Q19: Which of the following is not held
Q27: The steeper slope of the aggregate supply
Q28: Which of the following is an impact
Q32: In the long-run, the aggregate supply curve
Q44: A change in foreign demand does not
Q69: The figure given below represents the equilibrium
Q106: In the Keynesian case, an increase in
Q122: Which of the following is not a