Multiple Choice
The figure given below represents the equilibrium real GDP and price level in the aggregate demand and aggregate supply model.
Figure 8.3
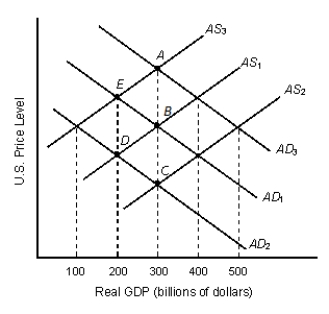
-Refer to Figure 8.3. Movement from point B to point D could be initiated by:
A) a stock market crash that undermines consumer confidence.
B) a tax code changes that improve investor expectations.
C) a national emergency that increases government spending.
D) a higher net exports because of economic expansion in European countries.
E) a technological advancement.
Correct Answer:

Verified
Correct Answer:
Verified
Q18: Lower interest rates on business loans usually
Q19: Which of the following is not held
Q27: The steeper slope of the aggregate supply
Q64: The figure given below represents the equilibrium
Q72: A lower domestic price level raises aggregate
Q74: The figure given below represents the
Q93: A rightward shift in the aggregate supply
Q96: Which of the following could lead to
Q113: The wealth effect, the interest rate effect,
Q122: Which of the following is not a