Multiple Choice
The figure given below represents the equilibrium price and output in the market for restaurant meals and delivery meals.
Figure 4.1
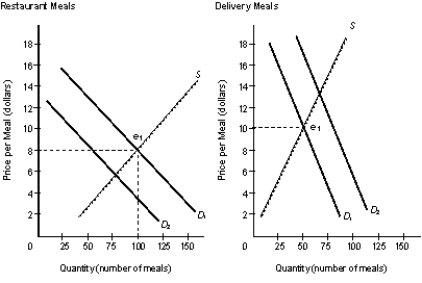
-Refer to Figure 4.1. In which direction will the resources flow following a shift in the demand for Restaurant Meals and Delivery Meals as represented by the figure?
A) Resources flow from where they are more highly valued to where they are less highly valued in order to make the consumer better off.
B) Resources flow from where they are more highly valued to where they are less highly valued in order to reduce prices.
C) Resources flow from where they are more highly valued to where they are less valued in order to reduce costs.
D) Resources flow from Restaurant production and sales to Delivery production and sales.
E) Resources flow to Restaurant production and sales and away from Delivery production and sales.
Correct Answer:

Verified
Correct Answer:
Verified
Q8: Consider the circular flow of income model
Q18: A surplus in a country's trade balance
Q41: Which of the following is true of
Q44: Which of the following flows from the
Q51: Based on the fact that the companies
Q52: The figure given below represents the circular
Q53: The figure given below represents the circular
Q54: Scenario 4-1<br>In a given year, country A
Q57: Which of the following is true of
Q62: When the government sector is included in