Multiple Choice
The figure given below represents the circular flow of income between households, firms, financial intermediaries, and foreign countries.
Figure 4.2
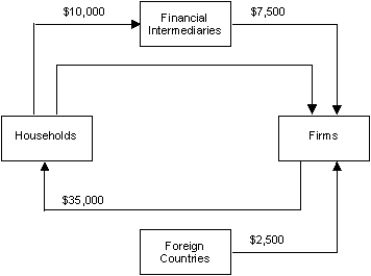
-Refer to Figure 4.2. What is the total savings of the household sector?
A) $35,000
B) $25,000
C) $17,500
D) $42,500
E) $45,000
Correct Answer:

Verified
Correct Answer:
Verified
Q8: Consider the circular flow of income model
Q18: A surplus in a country's trade balance
Q20: In 2009,combined government spending in the U.S.economy
Q41: Which of the following is true of
Q44: Which of the following flows from the
Q52: The figure given below represents the circular
Q52: Mark's ability to purchase goods and services
Q56: The figure given below represents the equilibrium
Q57: Which of the following is true of
Q59: Scenario 4-1<br>In a given year, country A