Multiple Choice
Sketch the graph of the function below. Choose a scale that allows all relative extrema and points of inflection to be identified on the graph.
A) 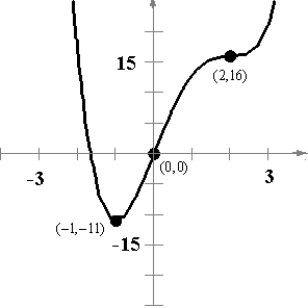
B) 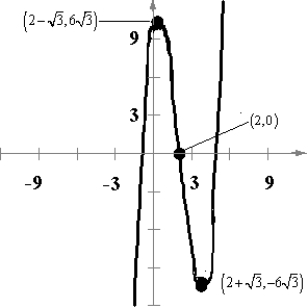
C) 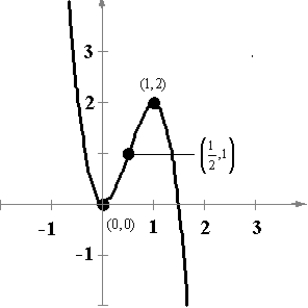
D) 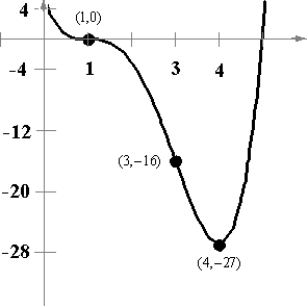
E) 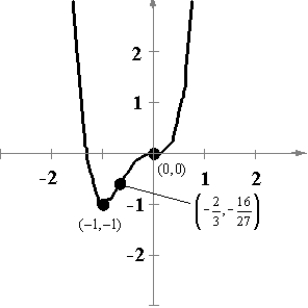
Correct Answer:

Verified
Correct Answer:
Verified
Related Questions
Q2: p is in dollars and q
Q3: Compare dy and <span class="ql-formula"
Q4: Find the limit: <span class="ql-formula"
Q5: A power station is on one
Q6: Analytically determine the location(s) of any
Q7: The variable cost for the production
Q8: Analyze and sketch a graph of
Q9: Find the dimensions of the rectangle
Q10: If the total revenue function for
Q11: Sketch the graph of the function