Multiple Choice
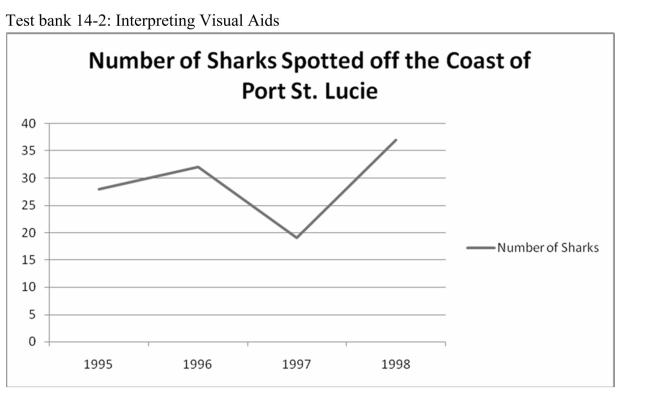
-The line graph above shows
A) a steady increase in the number of sharks.
B) a steady decrease in the number of sharks.
C) a sharp downturn in the numbers of sharks followed by an increase.
D) a fluctuation in the number of sharks.
Correct Answer:

Verified
Correct Answer:
Verified
Q1: To better understand the textbook, a reader
Q2: Highlighting or writing in the margin of
Q3: <img src="https://d2lvgg3v3hfg70.cloudfront.net/TB8694/.jpg" alt=" -What is the
Q4: A _ shows how a condition or
Q6: <img src="https://d2lvgg3v3hfg70.cloudfront.net/TB8694/.jpg" alt=" -What is the
Q7: When using the double column note taking
Q8: <img src="https://d2lvgg3v3hfg70.cloudfront.net/TB8694/.jpg" alt=" -The line graph
Q9: <img src="https://d2lvgg3v3hfg70.cloudfront.net/TB8694/.jpg" alt=" -What is the
Q10: <img src="https://d2lvgg3v3hfg70.cloudfront.net/TB8694/.jpg" alt=" -What is the
Q11: The formula for a good summary is