Multiple Choice
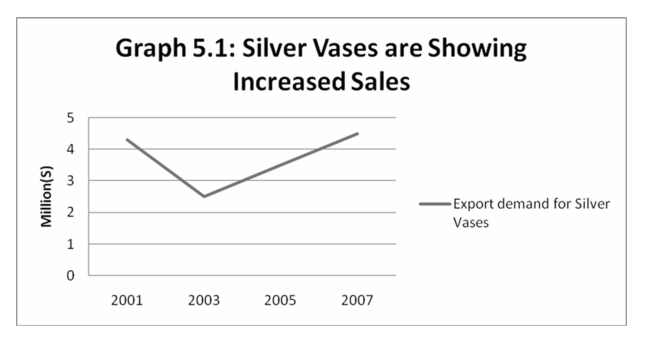
-The line graph shows
A) a steady decrease in the export demand.
B) a steady increase in the export demand.
C) a fluctuations in the export demand.
D) The line graph does not discuss export demand.
Correct Answer:

Verified
Correct Answer:
Verified
Q3: <img src="https://d2lvgg3v3hfg70.cloudfront.net/TB8694/.jpg" alt=" -What is the
Q4: A _ shows how a condition or
Q5: <img src="https://d2lvgg3v3hfg70.cloudfront.net/TB8694/.jpg" alt=" -The line graph
Q6: <img src="https://d2lvgg3v3hfg70.cloudfront.net/TB8694/.jpg" alt=" -What is the
Q7: When using the double column note taking
Q9: <img src="https://d2lvgg3v3hfg70.cloudfront.net/TB8694/.jpg" alt=" -What is the
Q10: <img src="https://d2lvgg3v3hfg70.cloudfront.net/TB8694/.jpg" alt=" -What is the
Q11: The formula for a good summary is
Q12: A good way to rehearse the information
Q13: <img src="https://d2lvgg3v3hfg70.cloudfront.net/TB8694/.jpg" alt=" -What is the