Multiple Choice
Consider a genetic network consisting of gene A whose product activates the transcription of gene R. Imagine that the concentration of protein A is suddenly changed by a significant amount. The following graphs show how the concentration of protein R would then change over time to reach steady state again. The two curves (1 and 2) in each graph correspond to systems that have different transcription rates for A. For one of the two graphs (A or B) a negative feedback loop is present, in which protein R represses the transcription of gene A. Which conclusion is correct according to these results? 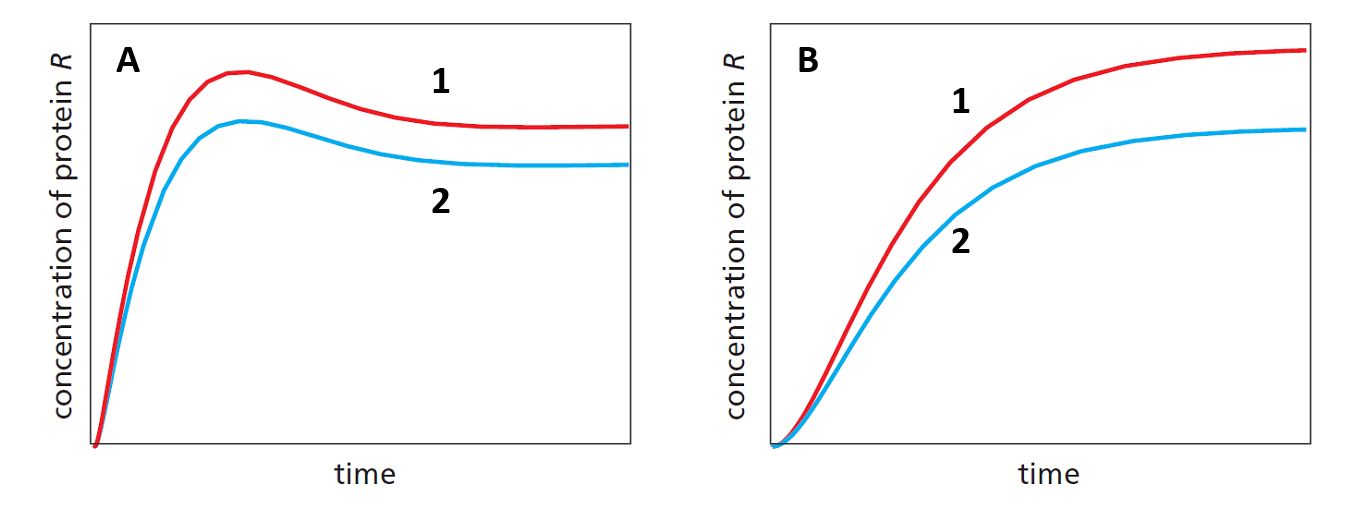
A) The negative feedback loop makes the system slower in reaching the steady state.
B) With negative feedback, the steady-state concentration is less sensitive to fluctuations in kinetic rate constants.
C) Higher transcription rates for gene A result in lower steady-state levels of protein R both with and without negative feedback.
D) All of the above.
Correct Answer:

Verified
Correct Answer:
Verified
Q24: Indicate whether each of the following descriptions
Q25: Migration of proteins during separation by SDS
Q26: You have used a reporter gene system
Q27: Each cycle of PCR doubles the amount
Q28: Due to friction with molecules of the
Q30: Which equation better describes the steady-state concentration
Q31: You have studied mutations in a transcription
Q32: What are the advantages of monoclonal antibodies
Q33: Three subunits of a protein complex have
Q34: The EcoRI restriction enzyme recognizes and cuts