Short Answer
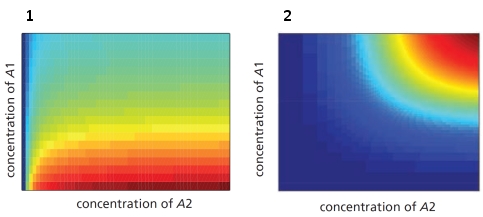
In the schematic graphs below, the red color indicates high gene expression and blue color indicates low gene expression. The expression level is plotted as a function of the concentrations of two transcription regulatory proteins, A1 and A2. Which graph (1 or 2) do you think corresponds to an "AND NOT" combinatorial logic? Write down 1 or 2 as your answer.
Correct Answer:

Verified
Graph 1 corresponds to an AND...View Answer
Unlock this answer now
Get Access to more Verified Answers free of charge
Correct Answer:
Verified
View Answer
Unlock this answer now
Get Access to more Verified Answers free of charge
Q55: Which of the following chromatography methods resembles
Q56: Imagine a bistable system composed of two
Q57: Bacterial artificial chromosomes (BACs) …<br>A) are derived
Q58: The following schematic graph shows temperature change
Q59: Which of the following methods provides the
Q61: You have used a variation of fluorescence
Q62: In SDS-PAGE of proteins, …<br>A) the proteins
Q63: Which of the following can limit the
Q64: In a bacterium that is normally cylindrical
Q65: To create cellular factories for monoclonal antibody