Short Answer
In the following graph, the elongation rate of pure actin filaments as a function of actin subunit concentration is shown as a dashed line. Which one of the other five lines (A to E) would you think better shows what happens when a plus-end capping protein such as CapZ is present? 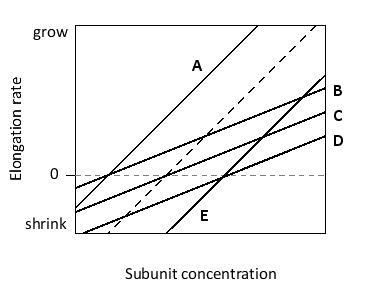
Correct Answer:

Verified
Correct Answer:
Verified
Q2: Indicate true (T) and false (F) statements
Q3: From left to right, indicate if each
Q4: The γ-tubulin ring complex is to microtubules
Q5: The actin-nucleating protein formin has flexible "whiskers"
Q6: Indicate whether each of the following structures
Q7: If the concentration of free subunits is
Q8: In the following schematic drawing, in which
Q9: What is the major microtubule-organizing center in
Q10: Which of the following is NOT an
Q11: Indicate whether each of the following descriptions