Multiple Choice
In the following graph that shows changes in the lengths of two microtubules over time, which time point corresponds to a catastrophe for both microtubules? Which trace corresponds to a microtubule with greater dynamic instability? 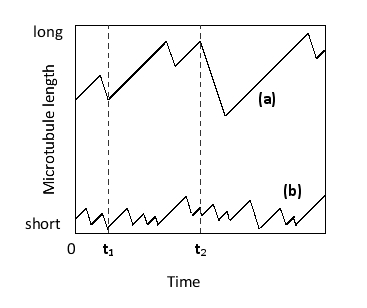
A) t₁; trace (a)
B) t₁; trace (b)
C) t₂; trace (a)
D) t₂; trace (b)
Correct Answer:

Verified
Correct Answer:
Verified
Q56: Consider the structure of a sarcomere. Which
Q57: Sort the following events to show the
Q58: Which of the following proteins do you
Q59: Indicate if each of the following structures
Q60: What are the typical consequences of mutations
Q62: A microtubule appears as a left-handed helix
Q63: If myosin II heads are attached to
Q64: According to the following graph, which shows
Q65: Cofilin binds preferentially to ADP-containing actin filaments
Q66: In the dendritic networks of actin filaments