Short Answer
Which of the following simplified diagrams better shows the changes in the concentrations of three major cyclin-Cdk complexes (G?/S-Cdk, S-Cdk, and M-Cdk) in the cell in different stages of the cell cycle? 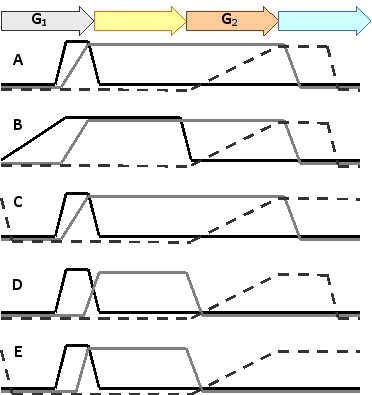
Correct Answer:

Verified
The G1/S-Cdk activity (solid black curve...View Answer
Unlock this answer now
Get Access to more Verified Answers free of charge
Correct Answer:
Verified
View Answer
Unlock this answer now
Get Access to more Verified Answers free of charge
Q45: Fill in the blank: "The … is
Q46: In most mammalian cells, low M-cyclin protein
Q47: Resveratrol is a natural compound found in
Q48: Indicate true (T) and false (F) statements
Q49: Indicate true (T) and false (F) statements
Q51: Which of the following events occurs in
Q52: Which of the following is more directly
Q53: Indicate whether each of the following occurs
Q54: Three models for contractile-ring positioning in animal
Q55: If cells that have started mitosis are