Short Answer
You have been studying the effect of loss-of-function mutations in the Cdk inhibitor protein (CKI) p21. You add the drug fucoxanthin to cell cultures harboring either wild-type or mutant versions of the p21 gene. Fucoxanthin is known to induce cell-cycle arrest in G1. After a day, you add the thymidine analog BrdU to the culture media, collect the cells after an hour, treat them with anti-BrdU antibody and the fluorescent DNA stain DAPI, and finally subject them to fluorescence-activated cell sorting (FACS). The FACS data can be viewed as a two-dimensional dot plot composed of thousands of dots, in which each cell is represented by one dot at coordinates that correspond to the intensities of the DAPI fluorescence signal (X axis) and BrdU fluorescence signal (Y axis) for that cell. Answer the following question(s) according to the simplified dot plot below, generated from your experiment.
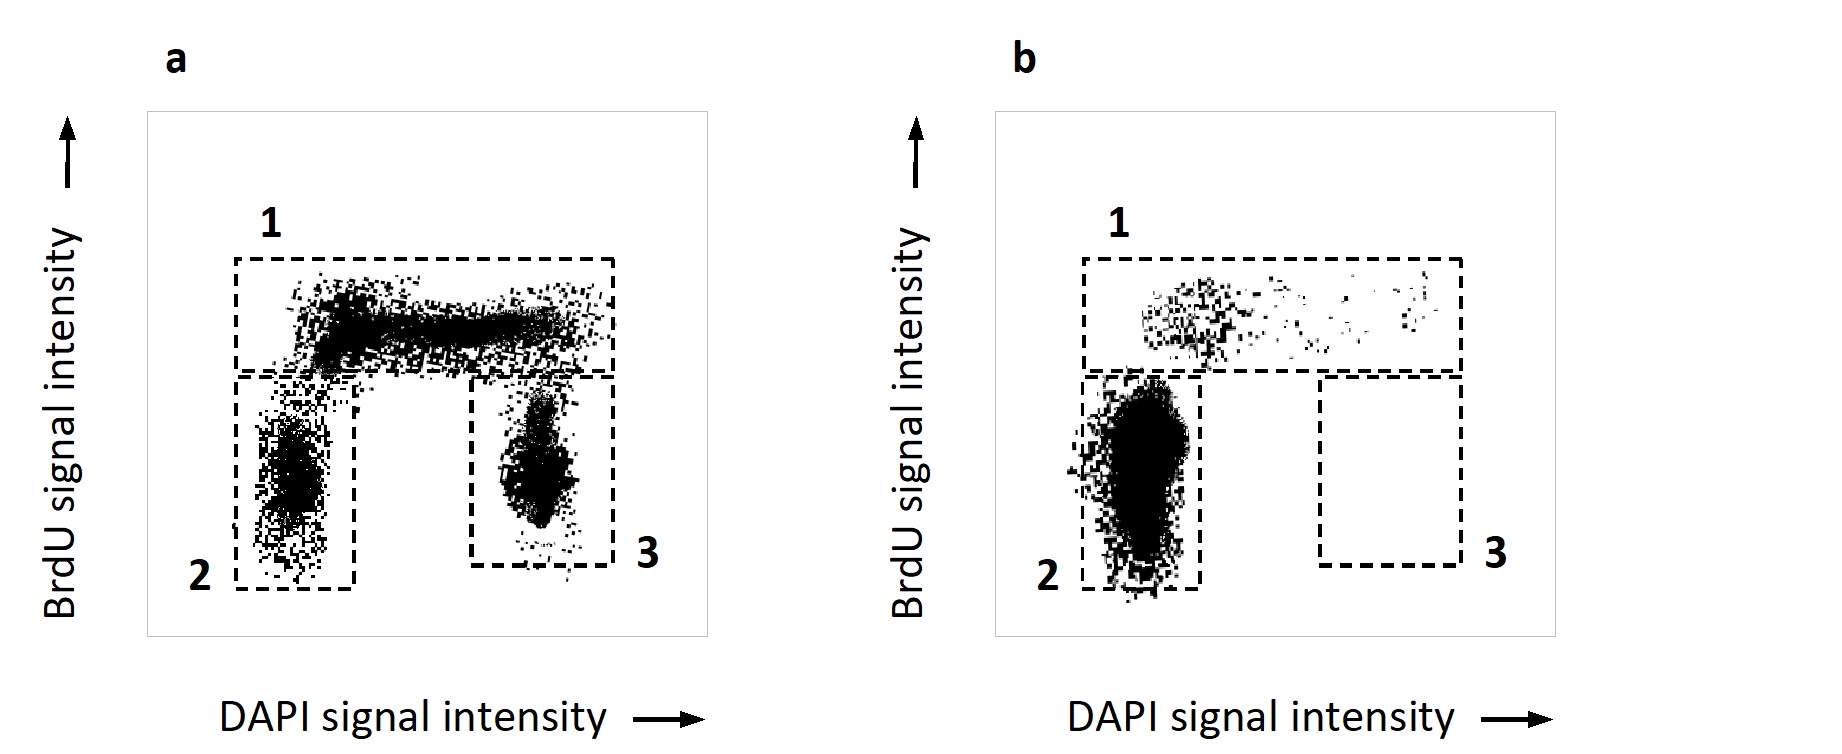
-Indicate which boxed region (1, 2, or 3) in the FACS plots corresponds better to each of the following phases of the cell cycle. Your answer would be a three-digit number composed of numbers 1 to 3, with each number used once, e.g. 312.
( ) G1 phase
( ) S phase
( ) G2 and M phases
Correct Answer:

Verified
After a short incubation with BrdU, ce...View Answer
Unlock this answer now
Get Access to more Verified Answers free of charge
Correct Answer:
Verified
After a short incubation with BrdU, ce...
View Answer
Unlock this answer now
Get Access to more Verified Answers free of charge
Q15: Which of the following cell populations in
Q16: To study chromosome movement during anaphase in
Q17: Formin nucleates the growth of parallel actin
Q18: Consider two kinesin motor proteins at the
Q19: Mammalian Cdk inhibitor proteins (CKIs) can be
Q21: Three models for contractile-ring positioning in animal
Q22: How is centrosome duplication similar to DNA
Q23: In the following schematic diagram of a
Q24: Indicate whether each of the following descriptions
Q25: Sort the following schematic diagrams (A