Short Answer
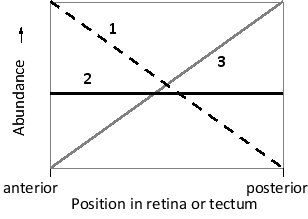
In the following graph, which line (1 to 3) better represents the changes in the level of EphA receptors on retinal axons along the anterior-posterior axis of the mouse retina? Which line better represents the changes in the abundance of EphrinA along the anterior-posterior axis of the mouse optical tectum? Write down your answer as a two-digit number, e.g. 22.
Correct Answer:

Verified
Neurons in the posterior reti...View Answer
Unlock this answer now
Get Access to more Verified Answers free of charge
Correct Answer:
Verified
View Answer
Unlock this answer now
Get Access to more Verified Answers free of charge
Q51: The following graph qualitatively represents the gradients
Q52: In a developing Drosophila melanogaster embryo, a
Q53: An axonal growth cone has reached a
Q54: Indicate whether each of the following conditions
Q55: Assuming that the only function of Short
Q56: Consider Agrin signaling in the formation of
Q58: A cross section of a developing spinal
Q59: TSH is a pituitary hormone that stimulates
Q60: CFSE (carboxyfluorescein succinimidyl ester) is a cell-tracing
Q61: Indicate whether each of the following descriptions