Multiple Choice
Antigens and antibodies can form large, insoluble, cross-linked aggregates that precipitate from solution. The maximal amount of precipitant is observed at a certain antigen/antibody ratio; adding either excess antigen or excess antibody can prevent (or even reverse) the precipitation. Consider an antigen with multiple identical antigenic determinants that can be recognized by either bivalent or decavalent (i.e. pentameric) antibodies with binding sites that recognize the determinants. The amount of precipitation in the presence of a constant antigen concentration is plotted as a function of antibody concentration in the following qualitative graph. Which curve (1 or 2) in the graph do you think corresponds to the bivalent antibody? Would you expect to see such a bell-shaped curve if the antibodies were monovalent? 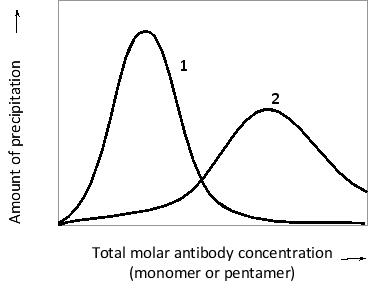
A) Curve 1; yes
B) Curve 2; yes
C) Curve 1; no
D) Curve 2; no
E) Curve 2; only if the antigen was also monovalent
Correct Answer:

Verified
Correct Answer:
Verified
Q16: Where are the hypervariable regions located in
Q17: Indicate true (T) and false (F) statements
Q18: A cell has been infected with an
Q19: From an evolutionary perspective, which mating pattern
Q20: How many hypervariable loops are there in
Q22: Mice whose immune systems had previously rejected
Q23: Blood-group compatibility is an important consideration in
Q24: In the following schematic diagram, which curve
Q25: Indicate whether each of the following descriptions
Q26: Indicate whether each of the following descriptions