Short Answer
In the following schematic diagram, which curve (A to D) do you think better shows the qualitative relationship between the affinity of a developing T cell's TCR for self-peptide-MHC complexes in the thymus and the survival chance of the cell? 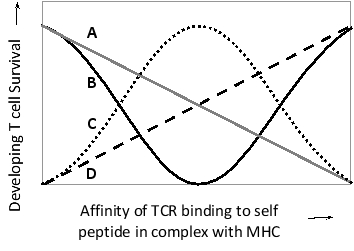
Correct Answer:

Verified
Too low or too high...View Answer
Unlock this answer now
Get Access to more Verified Answers free of charge
Correct Answer:
Verified
View Answer
Unlock this answer now
Get Access to more Verified Answers free of charge
Q19: From an evolutionary perspective, which mating pattern
Q20: How many hypervariable loops are there in
Q21: Antigens and antibodies can form large, insoluble,
Q22: Mice whose immune systems had previously rejected
Q23: Blood-group compatibility is an important consideration in
Q25: Indicate whether each of the following descriptions
Q26: Indicate whether each of the following descriptions
Q27: How are natural killer (NK) cells different
Q28: A patient with persisting larger-than-normal lymph nodes
Q29: Indicate whether each of the following normally