Multiple Choice
The bar graph shows the expenditures of one city government in a recent year. 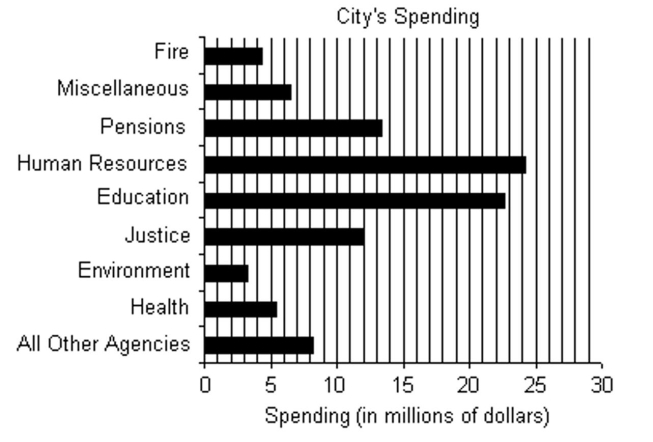
-Name the agency whose spending is between $3 million and $4 million and estimate its value.
A) Fire; $3.2 million
B) Fire; $4.3 million
C) Environment; $3.2 million
D) Environment; $4.3 million
Correct Answer:

Verified
Correct Answer:
Verified
Related Questions
Q79: Fill in the blank with one
Q80: Find the mode or modes (if any).<br>-7.05,
Q81: Use the information given to draw
Q82: The bar graph shows the number of
Q83: Twenty teenagers were asked to give
Q85: The circle graph shows the results of
Q86: Fill in the blank with one
Q87: Find the mean. If necessary, round to
Q88: Fill in the table. Round to
Q89: Fill in the blank with one